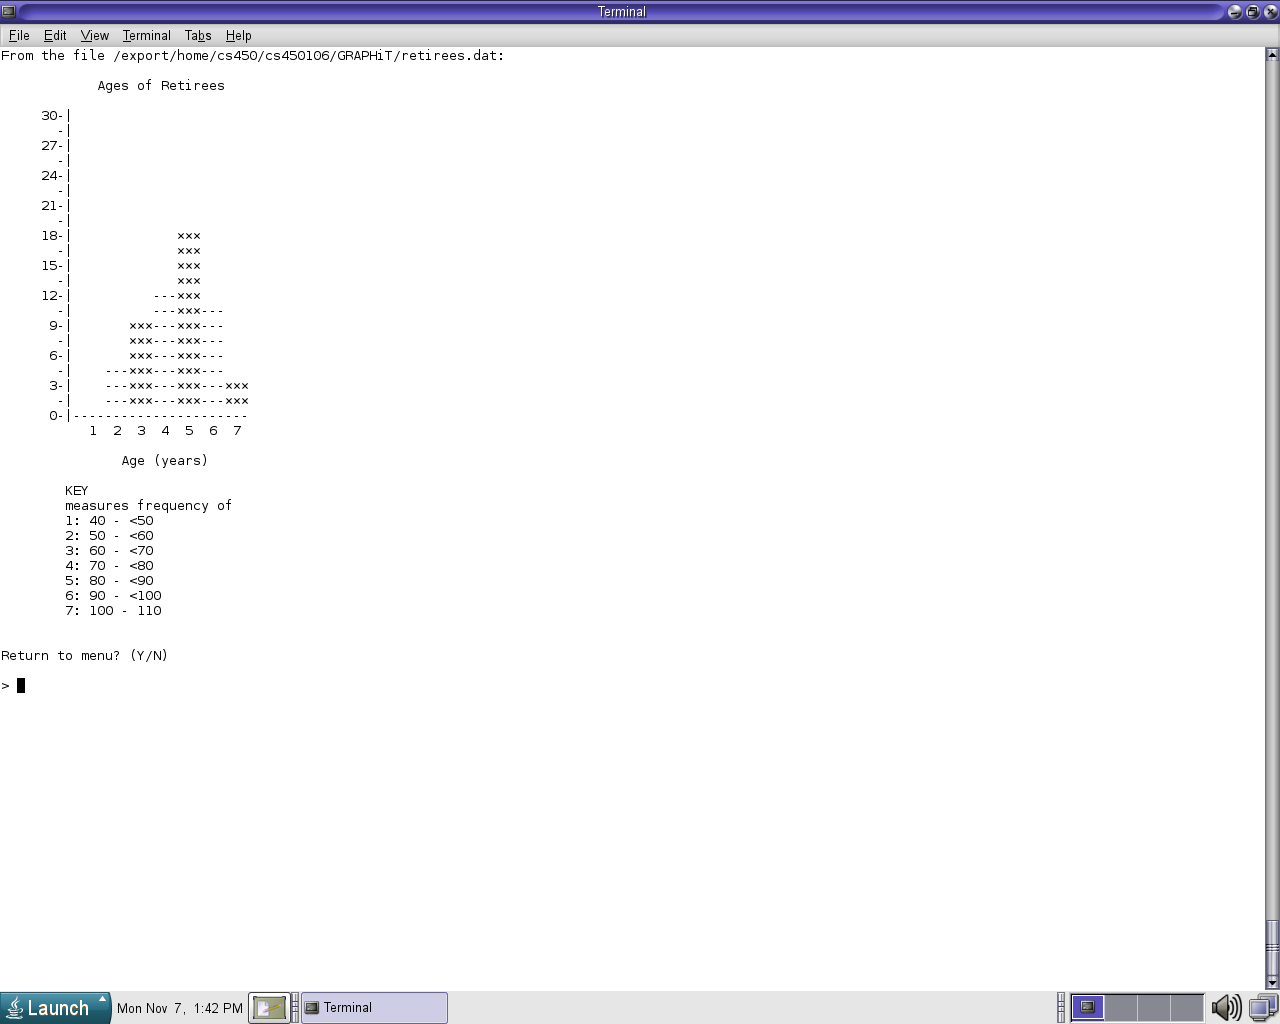
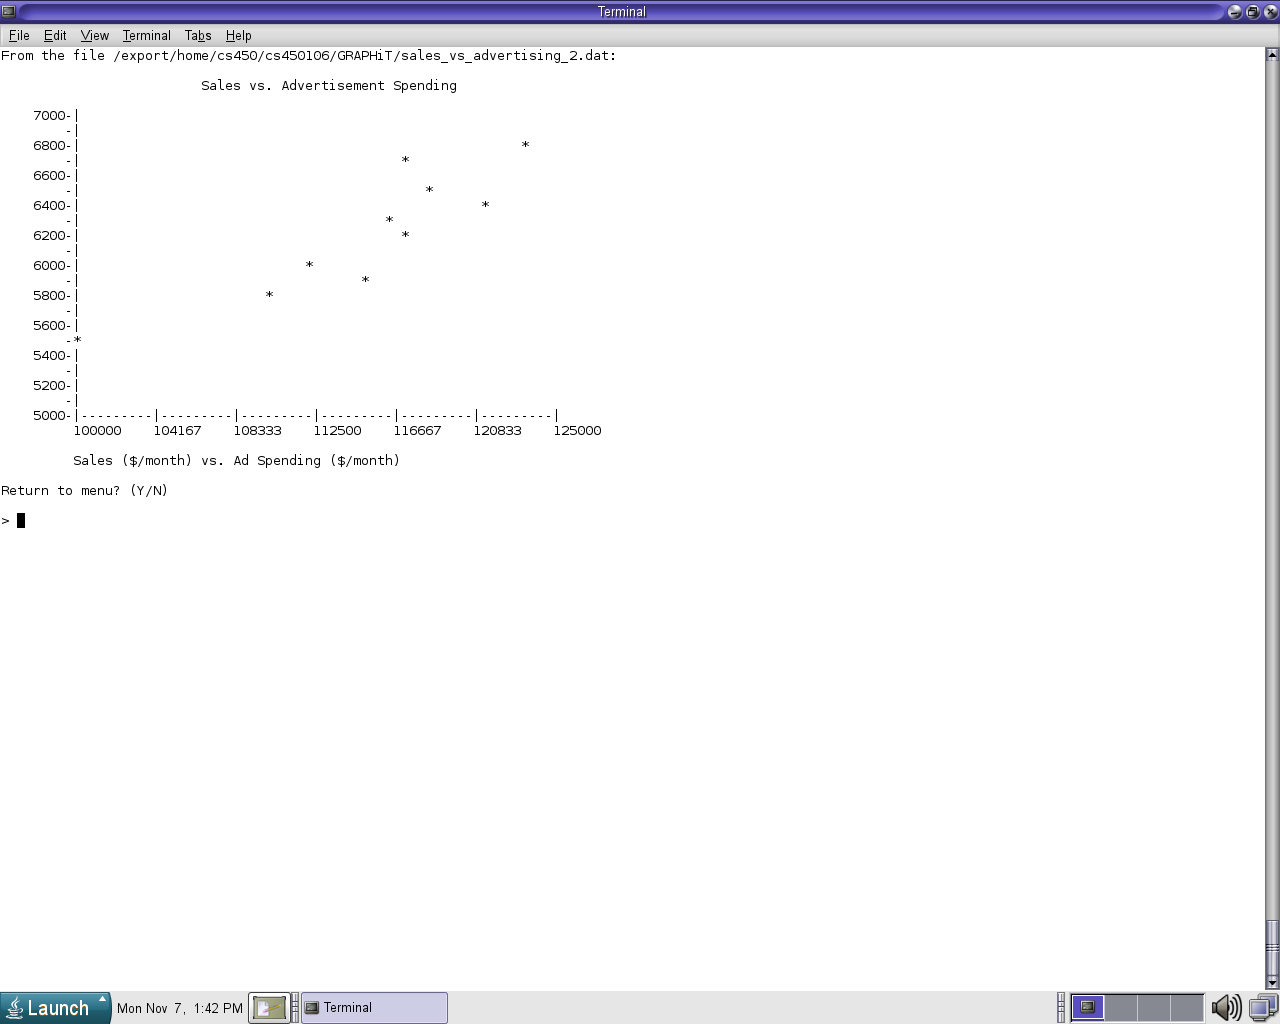
GRAPHiT is a program that allows the user to create and save bar charts, histograms, and scatter plots.
Here are some examples that show how the graphs appear.
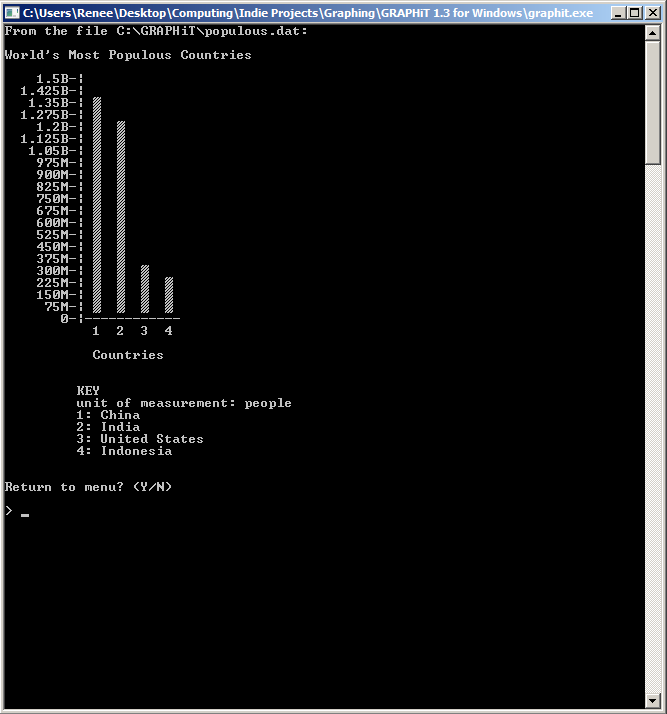
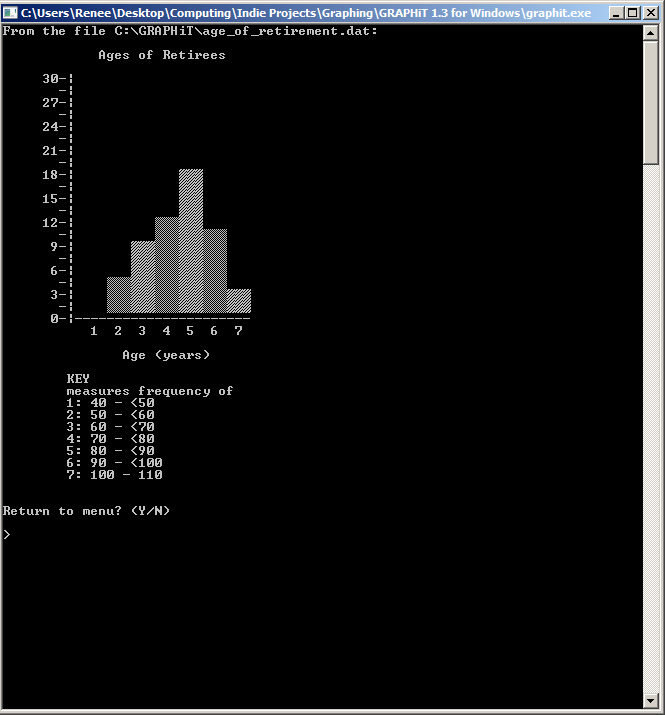
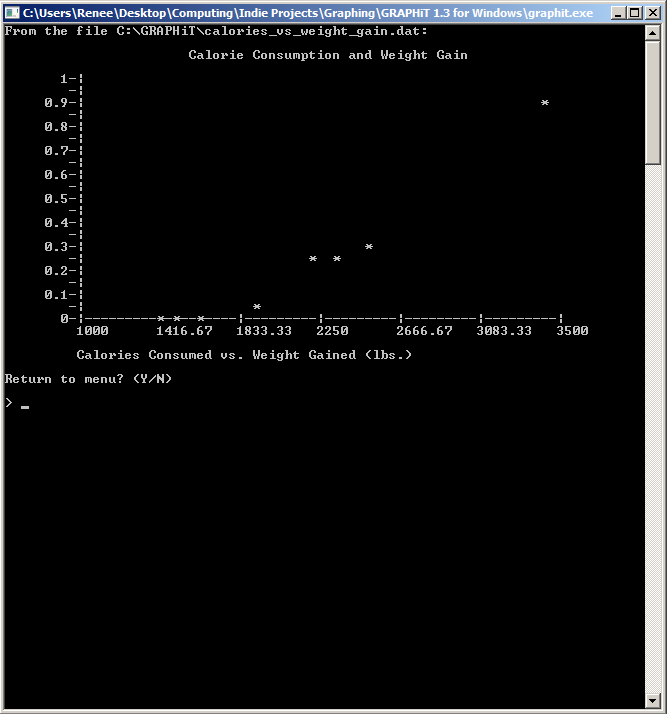
On Windows:
On Solaris x86:
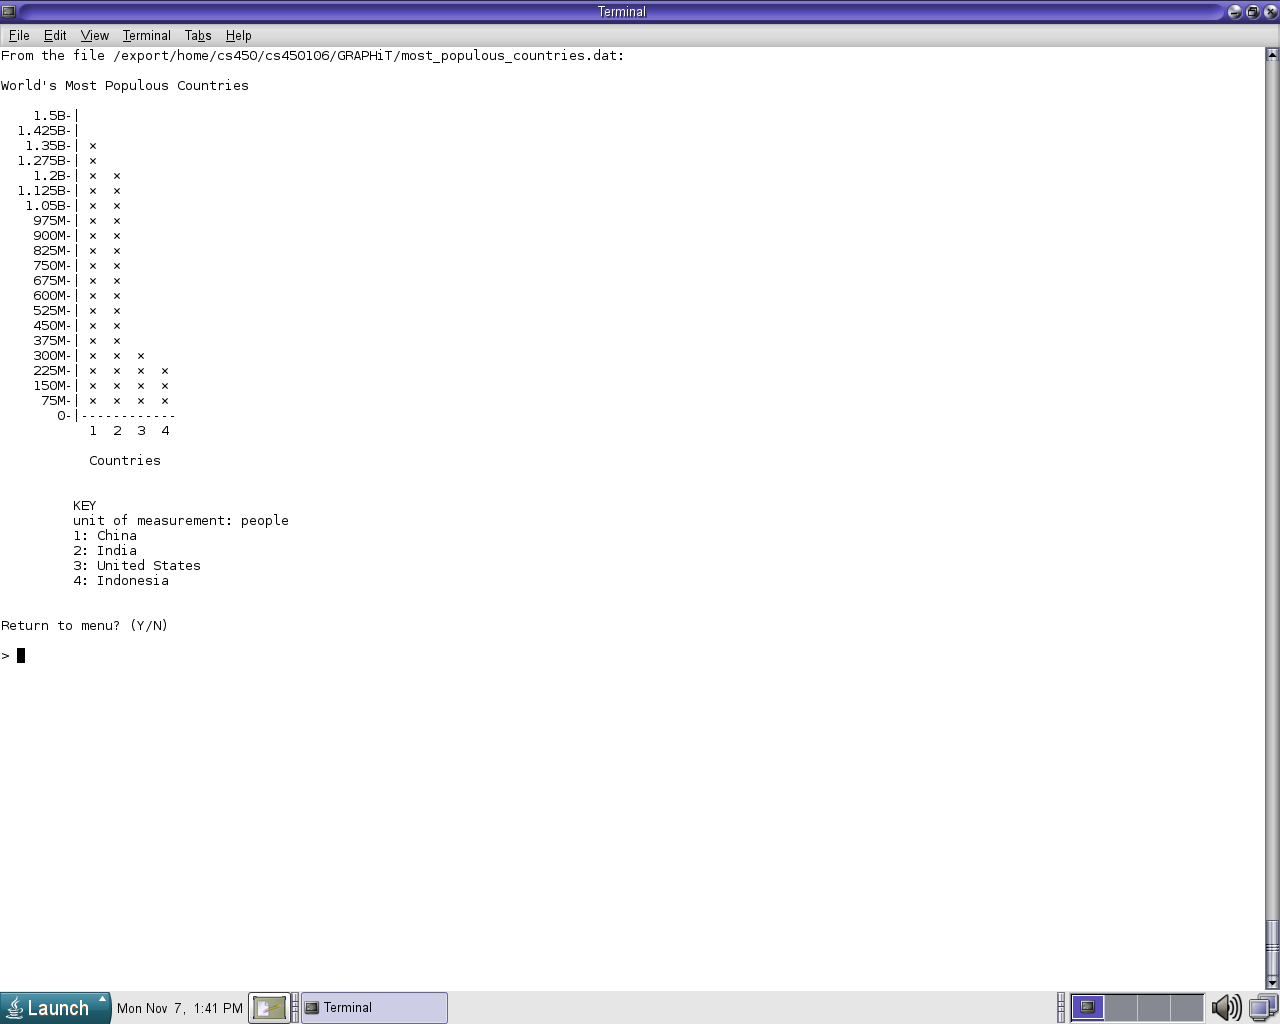
NOTE: Keep in mind that certain ASCII characters on various *nix machines appear differently (read: less prettily) through PuTTY.
*Tumblr voice* aesthetic
Download: